As I mentioned in a previous article, this website is purely static and has been so for a while now. However, the site structure and components have not been revisited for a number of years and while it was performing quite well (with a page size well under the current web page average size), a number of things were a bit overkill and unnecessary. As an example, the site was relying on a full fledge front-end component library containing both Javascript and CSS files which were barely used. It was time to perform some clean up activities to identify what was actually used or not to try and see how this could improve the overall website performance.
1. Starting Point
The website is using an old version of INK having both Javascript and CSS components. Using Pingdom, it is quite easy to run an analysis on some pages of the site to get an overview of:
- The load time of the page
- The page size
- The number of requests
- Splits of requests by content type and size
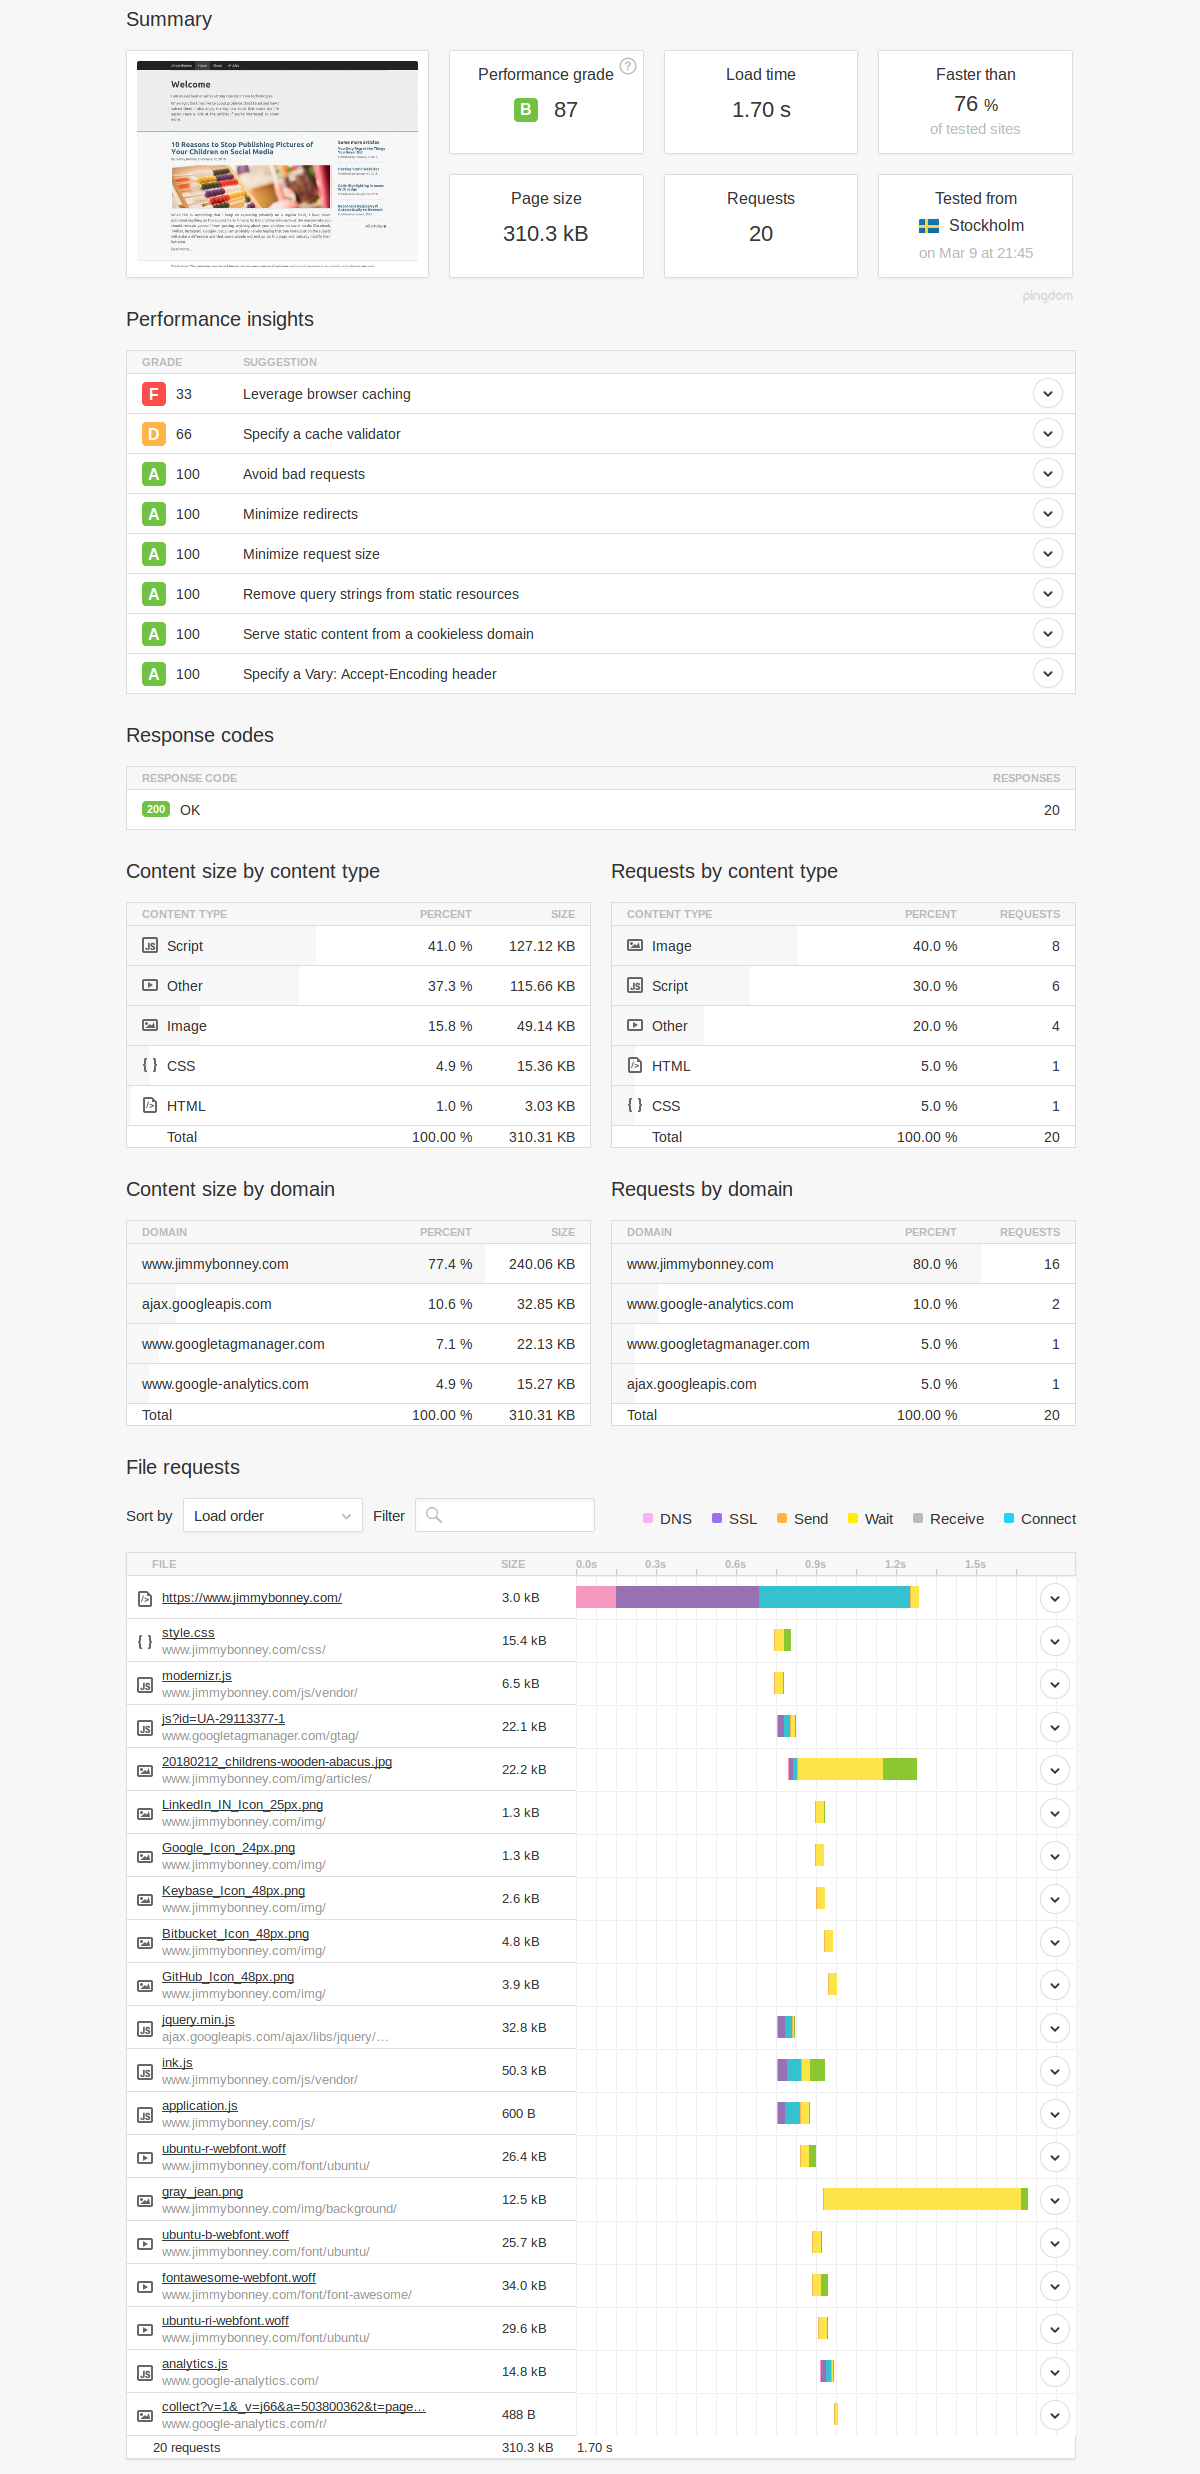
Let’s have a look at were we stand on the start page. The page size is only 310kB which is already way under the average page size of the last few years and bulk of the weight is coming from Javascript (41%), fonts (37.3%) and images (15.8%).
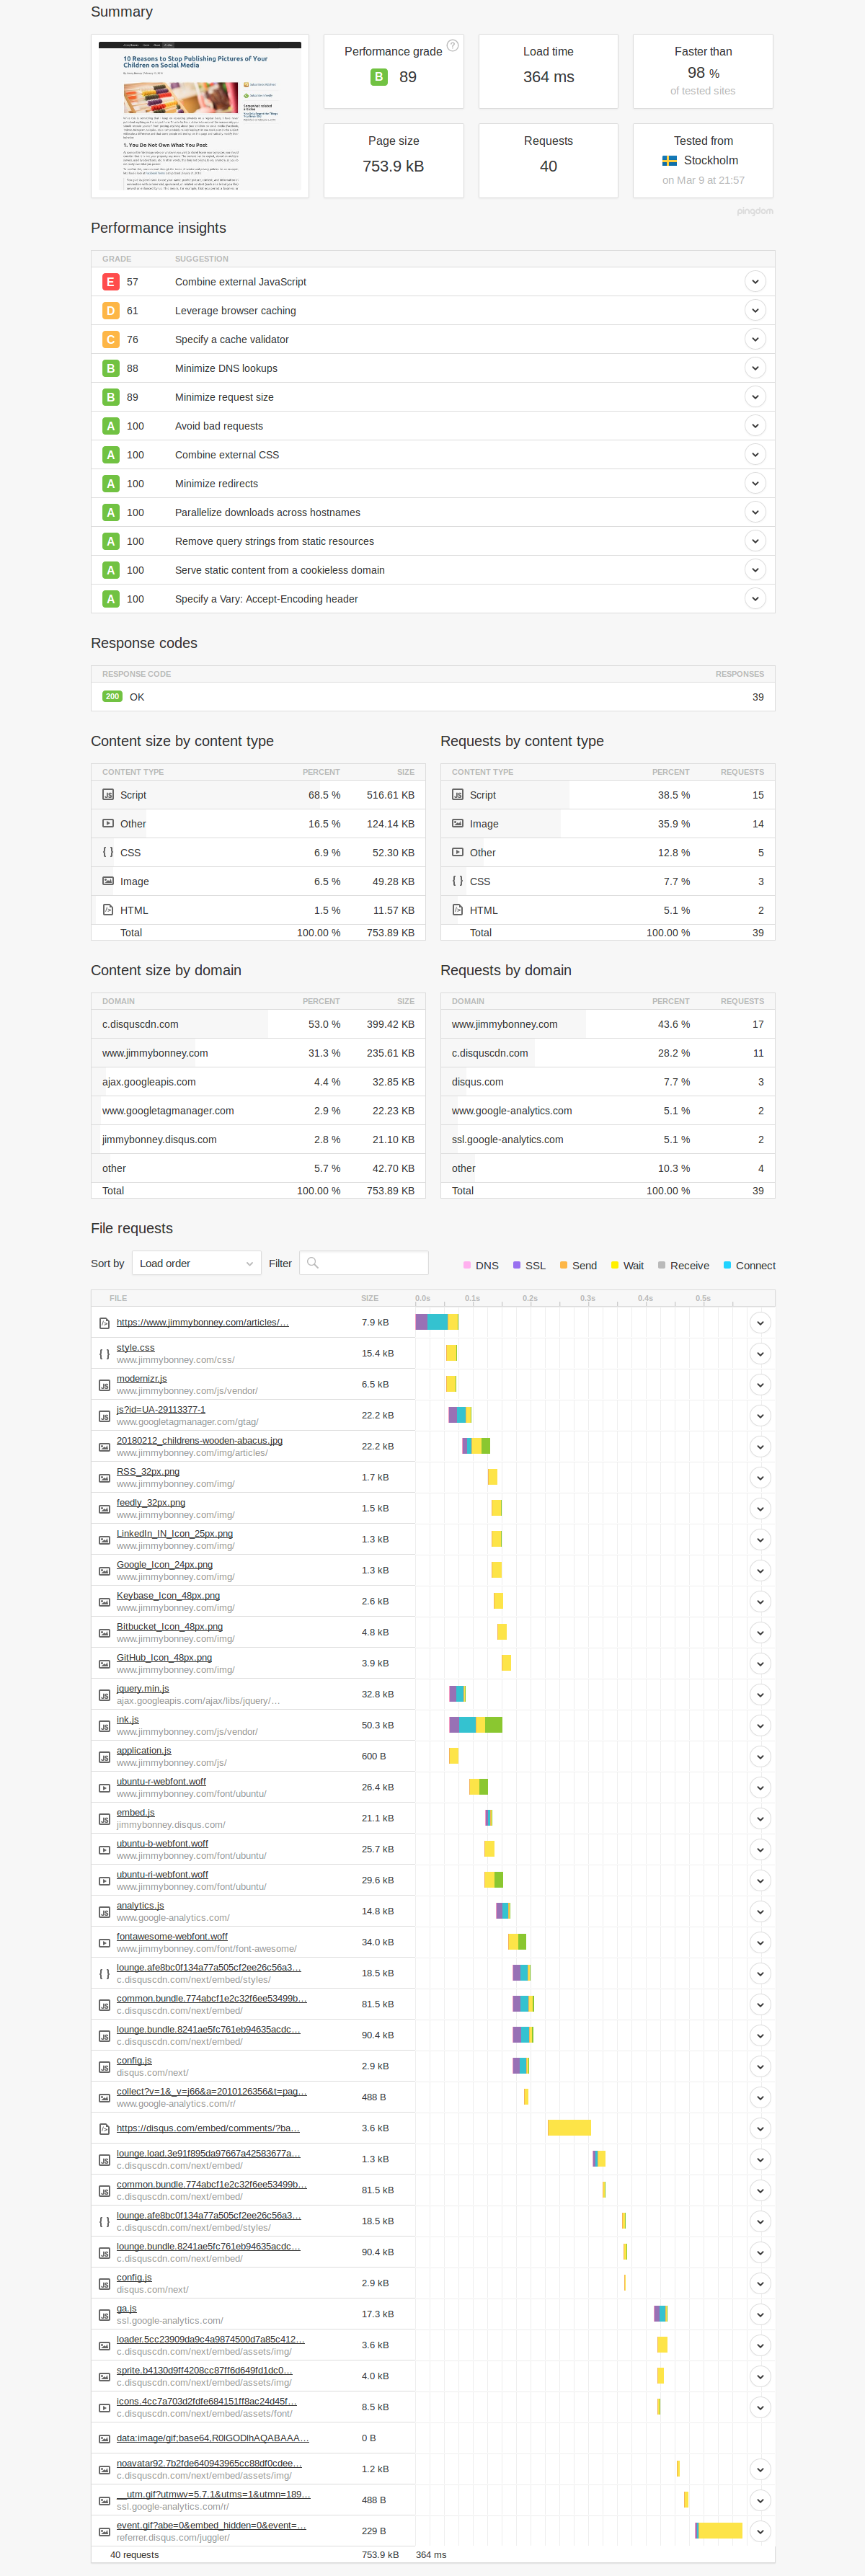
When looking at an article page in particular, we can see that the page size is more that doubled (753.9kB) compared to the start page and the number of requests is doubled as well. One interesting aspect which I believe is due to caching on Pingdom servers is that the load time was actually lower this time. Bulk of the content is still coming from Javascript and fonts but this time, CSS represents a bigger share than images.
Following this analysis on two pages, there are already a couple of takeaways:
- Reduce the Javascript footprint
- Use standard fonts rather than exotic ones
- Reduce the CSS footprint
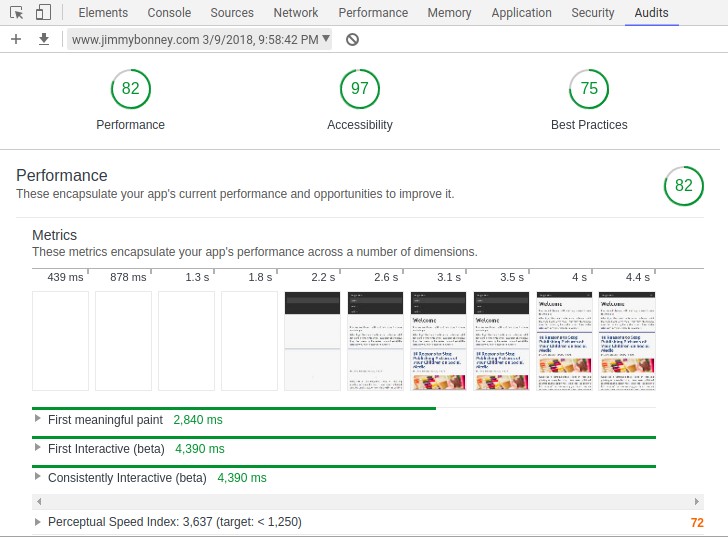
Google Chrome now also comes with an performance auditing tool that can provide some inputs as to what is most critical to address to improve the performance of the site.
2. Performance Improvements
Based on the performance analysis performed above, and as I mentioned in the introduction of this article, it was clear that a review of the front-end component library was due. In my case, I took a rather radical approach to completely remove the framework (INK) in place and decided to go with a small footprint CSS framework instead. The choice of the framework will be discussed in a later article, but for information I went with mini.CSS.
Replacing the framework obviously required some rework on the website but the benefit of having a generated static website is that pages are based on templates and those templates are the only files to be updated. The articles themselves being written in markdown are not impacted by this. In this case as well, I took the liberty to do some cleanup and remove a bunch of unused Javascript files.
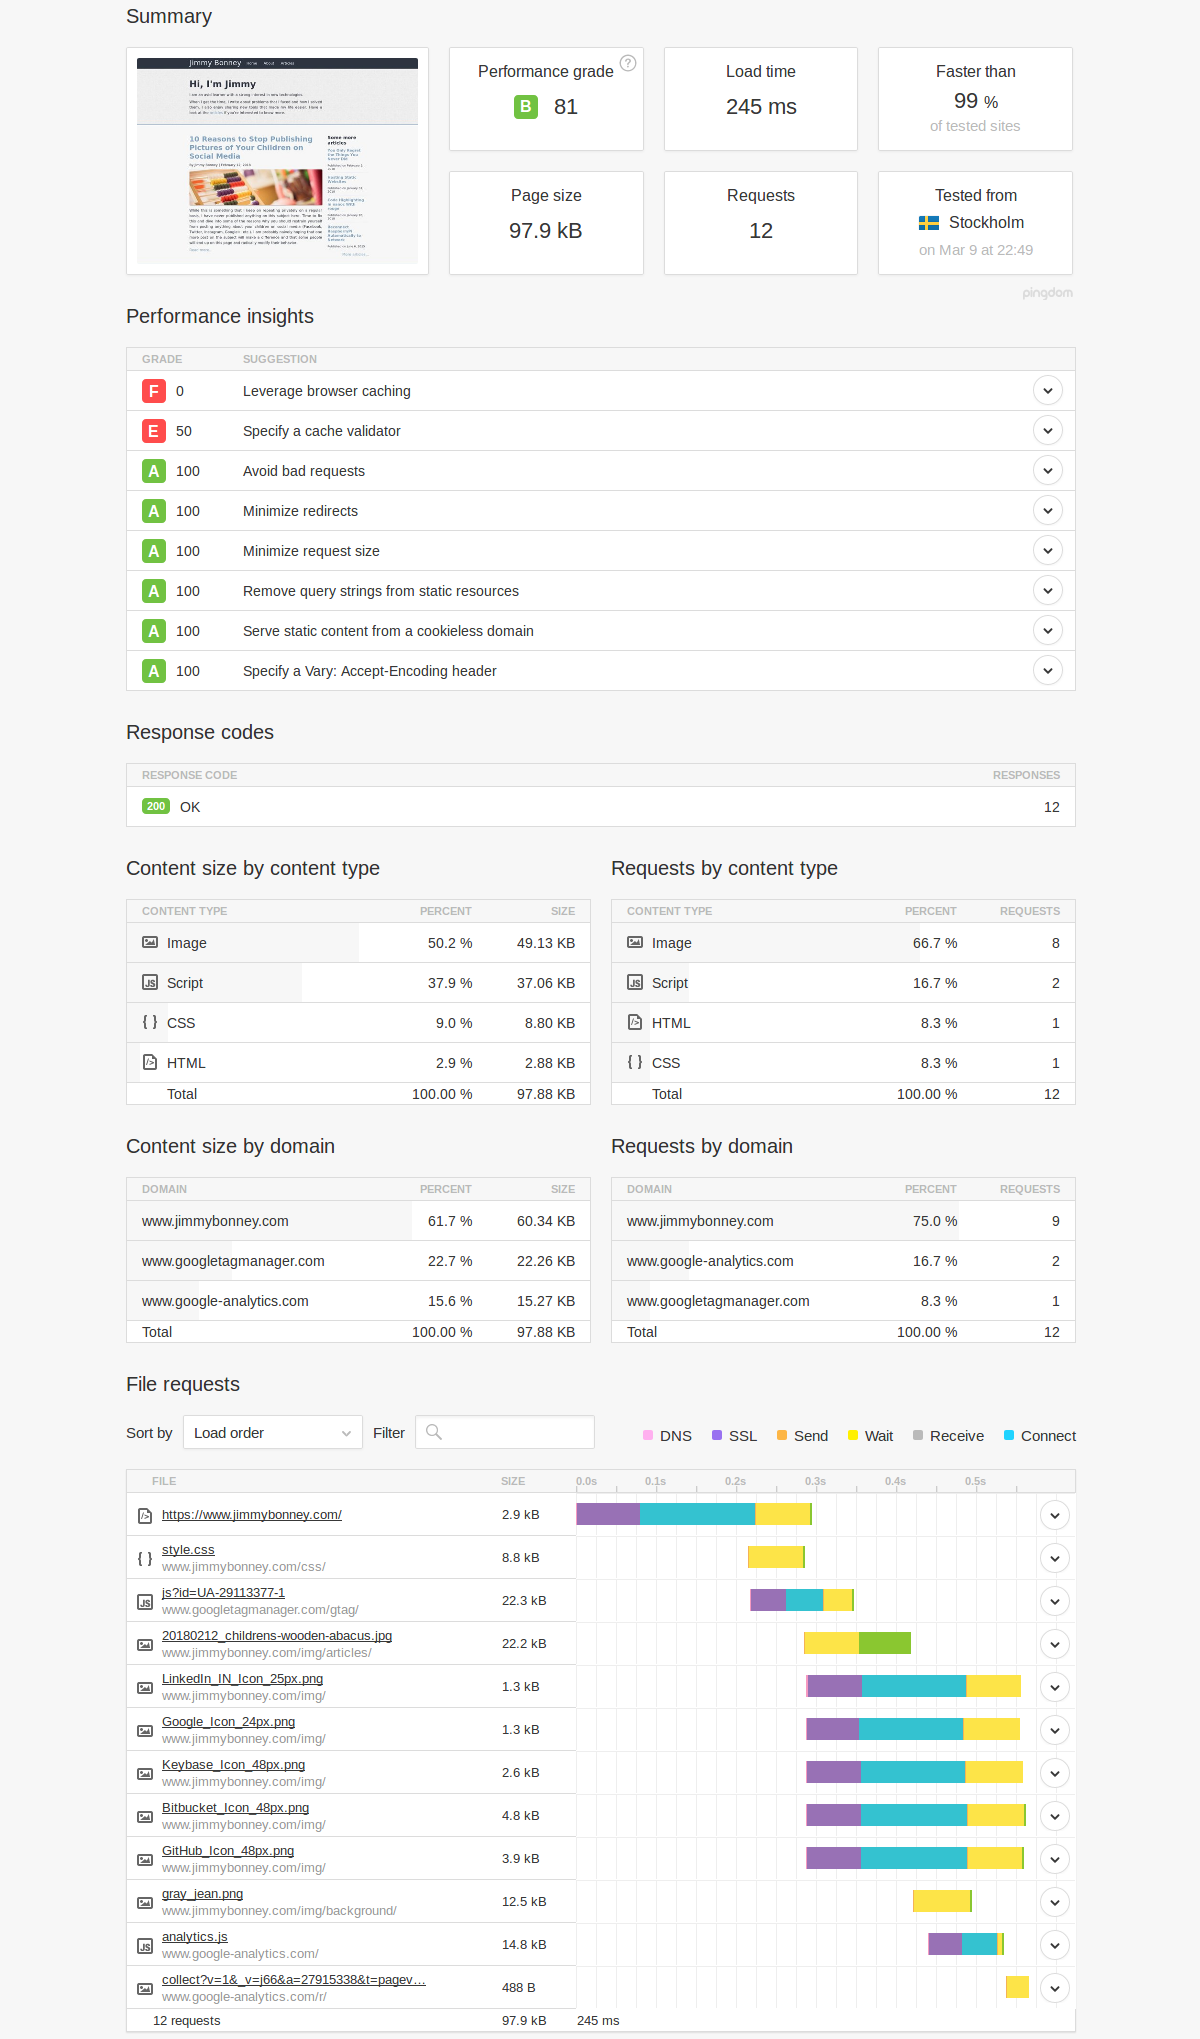
The results of these changes are speaking for themselves. As you can see below, the start page has a size that has been divided by 3, weighting less than 100kB currently. The number of requests has been reduced to 12 (from 20) and the biggest content by size is now images (which is more acceptable than having scripts in my case).
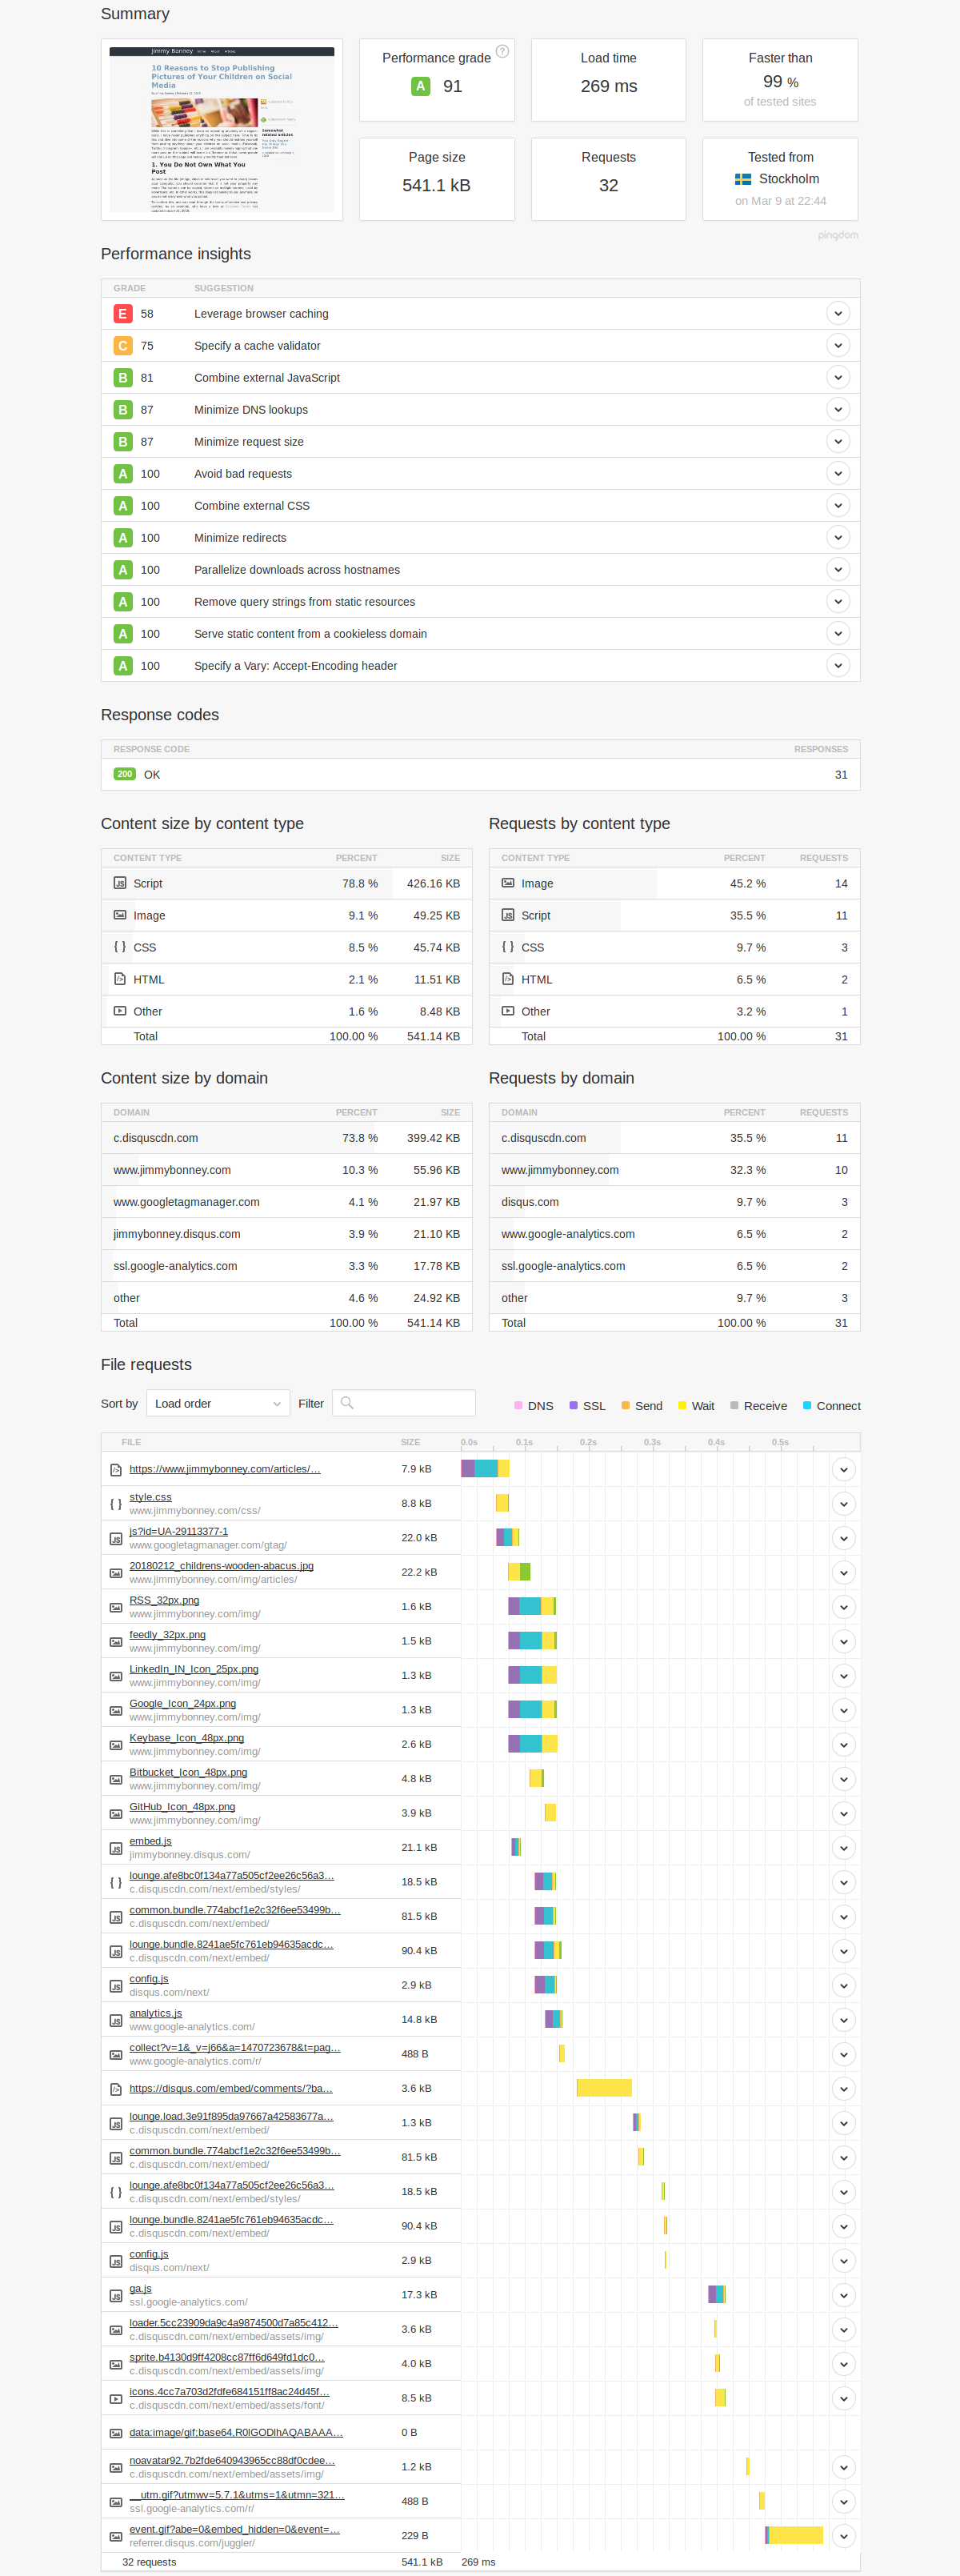
The article page also benefits from massive improvements. The page size is being reduced from 753.9kB to 541.1kB, and the number of requests is reduced to 32. What is worrying from this analysis is actually the part that the comment management system (Disqus) represents. After the page is loaded, it is nearly 400kB of data (almost 75% of the overall page). Looks like something might be needed there if we want to improve even further.
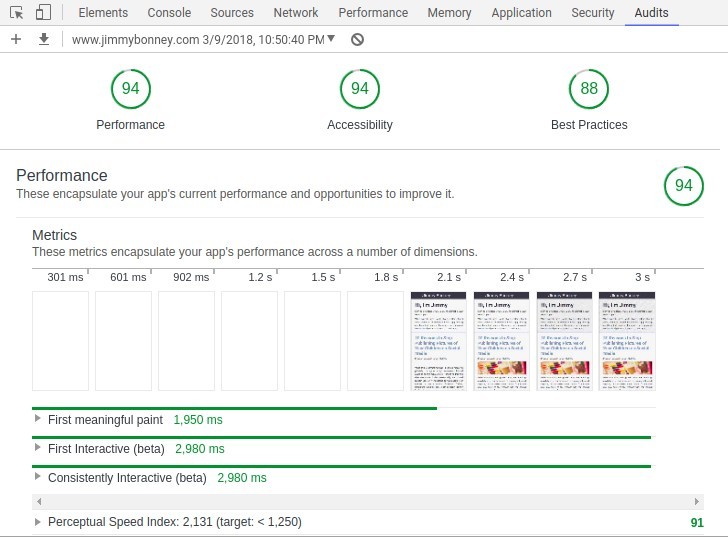
The performance audit from Chrome also shows some nice figures. The most important things to fix now seems to be related to images and non-blocking rendering of CSS.
3. Conclusion and Next Steps
Conducting a performance analysis on a website can be done at multiple levels. In this article, we focus on the page size and number of requests which ultimately has an impact on the load time. A number of tools are available to help out in conducting such analysis and while we chose to illustrate our case with Pingdom it might be interesting to cite a couple of other alternatives such as GTMetrix, WebPageTest, PageSpeed or dareboost. Some of the recommendations coming from those tools are of course similar but it is nonetheless interesting to get the reports from all of them because they also offer different focus areas.
As far as this site is concerned, the focus on the CSS framework allowed to drastically reduce the page size, number of requests and load time of the page. There are however still a number of things to accomplish if we would like to improve even more the performances of the site. The next activity will most likely be around grouping together small icons into a sprite so that the number of requests to the server can be reduced. As I highlighted above, I am not particularly impressed either by the footprint of Disqus which means that I will most likely look into another commenting system when time allows. Finally, one of the recommendations from Chrome was to use WebP images and there is some room for improvement as well in the overall CSS file that is being generated. It currently relies on the complete mini.CSS framework but a large number of classes and elements are actually not used on the site and could therefore be filtered out. Focusing on performance is a never ending story but we are now in a much better place than we have been for years.

For the time being, comments are managed by Disqus, a third-party library. I will eventually replace it with another solution, but the timeline is unclear. Considering the amount of data being loaded, if you would like to view comments or post a comment, click on the button below. For more information about why you see this button, take a look at the following article.